3 secrets to good customer satisfaction, teamwork or happy boss:
Ready for a new grafana story? Today I have some more: my brand new opensource repositories:
I realized them for myself, after I did not find anything good.
The exporter (telegraf-dam2ktado) is a plugin written in PHP that connects to the tado network (internet), fetches thermostat metrics and devices for your home installation, parses it as a single json and write this json to its stdout. It is signaled directly by telegraf which sends a empty new line on stdout that the plugin catches on its stdin. In this way, the plugin knows when telegraf wants to fetch new data, and telegraf can read parsed and cleaned data from tado so that it can collect metrics and put them to influxdb.
With all the metrics on influxdb one can create a beautiful dashboard on grafana (on cloud or on premise).
The installation instructions are on the respective projects home page.
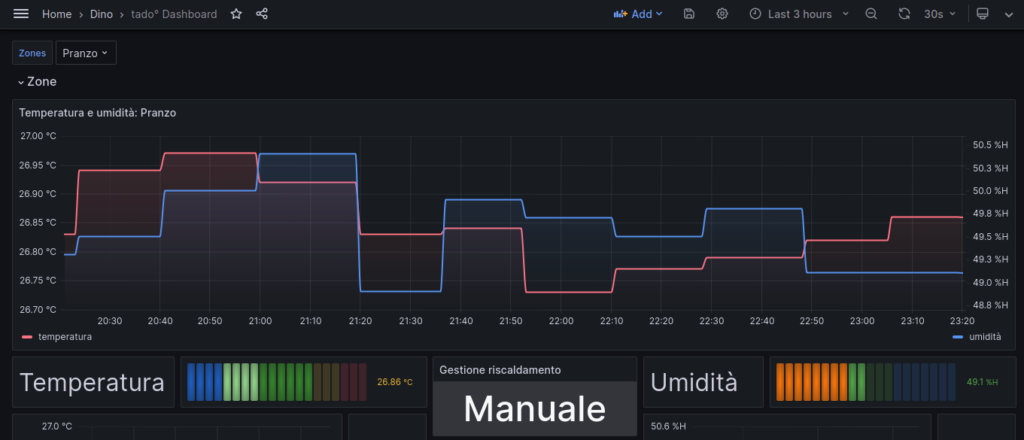
Now, some cool screenshots of my grafana dashboard (19301)…
So, with this second article about grafana we are going to dashboard a Fritz!box router.
Same as the previous article, you need a grafana+influxdb installation somewhere. Also you’ll need a linux host connected to the fritz router to monitor, a Raspberry pi 4 will be more than OK.
Install telegraf on your rpi4, then follow these instructions:
https://github.com/Ragin-LundF/telegraf_fritzbox_monitor
Once you’ve installed the required software you’ll end up with the sw installed into /opt/telegraf_fritzbox and a configuration file into /etc/telegraf/telegraf.d/telegraf_fritzbox.conf.
Open and modify this last file in this way:
[[inputs.exec]] commands = ["python3 /opt/telegraf_fritzbox/telegraf_fritzbox.py"] timeout = '30s' data_format = "influx" interval = "30s"
Now edit this file: /opt/telegraf_fritzbox/config.yaml and setup your fritz router’s username and password connection. NOTE: It’s a good thing to create a dedicated user.
It’s possible to test this command to check if the connection with ther router is working:
python3 /opt/telegraf_fritzbox/telegraf_fritzbox.py ; chown telegraf:telegraf /opt/telegraf_fritzbox/fritz.db
If everything is ok you should have a list of metrics coming from your router.
Please note that you need to enable UPnP status on your router networking configuration or you’ll have an error regarding a unknown service.
Now, restart telegraf with service telegraf restart.
It’s now time to import the grafana dashboard. I had big problems with the official json from https://github.com/Ragin-LundF/telegraf_fritzbox_monitor/blob/main/GrafanaFritzBoxDashboard_Influx2.json so I put my modified dashbord here.
Some screenshots here
A really big thank goes to the software author Ragin-LundF -> https://github.com/Ragin-LundF
There are tons of documentation and howtos on the web regarding system monitoring and metrics dashboards, so I don’t put all the boring stuff here.
You may want to have a central grafana and influxdb installation, then a telegraf installation on every node to monitor. For example you may have a grafana + influxdb installation somewhere in the cloud, a VPN, and a couple of raspberry pi nodes that gather metrics and send them to the central influxdb+grafana node for storage and visualization.
For this task, I use this beautiful grafana dashboard: https://grafana.com/grafana/dashboards/928-telegraf-system-dashboard/
Just import this dashbord to your local or remote grafana installation.
To make all those panels working, all your nodes to be monitored must have this telegraf plugins enabled and configured:
[[inputs.cpu]]
percpu = true
totalcpu = true
collect_cpu_time = false
report_active = false
core_tags = false
[[inputs.disk]]
ignore_fs = ["tmpfs", "devtmpfs", "devfs", "iso9660", "overlay", "aufs", "squashfs"]
[[inputs.diskio]]
[[inputs.kernel]]
[[inputs.mem]]
[[inputs.processes]]
use_sudo = false
[[inputs.swap]]
[[inputs.system]]
[[inputs.conntrack]]
files = ["ip_conntrack_count","ip_conntrack_max",
"nf_conntrack_count","nf_conntrack_max"]
dirs = ["/proc/sys/net/ipv4/netfilter","/proc/sys/net/netfilter"]
collect = ["all", "percpu"]
[[inputs.internal]]
[[inputs.interrupts]]
[inputs.interrupts.tagdrop]
irq = [ "NET_RX", "TASKLET" ]
[[inputs.linux_sysctl_fs]]
[[inputs.net]]
[[inputs.netstat]]
[[inputs.nstat]]
proc_net_netstat = "/proc/net/netstat"
proc_net_snmp = "/proc/net/snmp"
proc_net_snmp6 = "/proc/net/snmp6"
dump_zeros = true
Also, remember to configure your telegraf output to send collected metrics to your central influxdb node:
[[outputs.influxdb_v2]]
urls = ["http://192.168.0.2:8086"]
token = "A1ycabIZjg3XjulgubSanvPEdoj7UxqmEbsPADXX_h1Ns3-kTspG63s0SP3wuR0MGisd62rx9jLzExrhPvKAUg=="
organization = "YourOrg"
bucket = "YourBucket"
Enjoy your system telegraf metrics visualized 🙂
I found out that after I upgraded Debian from 11 to 12 the screen share functions from firefox and chrome (for example from a google meet meeting) is not working anymore. I did not share my screen with my colleagues.
In Debian 12 you are probably using PipeWire, Wayland and Gnome 43.
The solution for me was as simple as that:
apt install xdg-desktop-portal-gnome
This way firefox and chrome can reach gnome services inside the sandbox and the screen share is now working as expected.
What happens when you publish a message to an exchange in RabbitMQ with the wrong topic, or better, routing key? What happens if you send a message to the broker in a queue with a TTL policy or the TTL property is in the message itself and that TTL expires? What happens when a consumer discard your message got from the queue with no republish? What if a queue overflows due to a policy?
It’s simple, the broker will simply discard your message forever.
If this thing will make you mad like it does to me this blog article is for you. Here I will tell you how to create a simple tree of queues, DLX and policies to overcome this problem.
I think that starting with commands and examples is better than 10000 written words, and since I don’t have any ads on my blog I don’t have to write a long article to get money from the ads, so here we are.
I consider your RabbitMQ installation and your admin account ready, so we start with the commands.
# Create your VirtualHost
rabbitmqctl add_vhost vhtest --description "Your VH" --default-queue-type classic
# Give your admin user permissions to to everything on your virtualhost
rabbitmqctl set_permissions --vhost vhtest admin '.*' '.*' '.*'
# Create the user that will publish messages to the exchange
1
rabbitmqctl add_user testuserpub yourpassword
# Create the user that will subscribe to your queue to read messages
rabbitmqctl add_user testusersub yourpassword2
Now, we have 3 users (admin, testuserpub and testusersub) and a virtualhost (vhtest). We are ready to create 2 DLX, one to handle overflow, expired TTL and discarded messages, the other to handle messages sent with the wrong routing key. A DLX (or Dead Letter Exchange) is a particular exchange that is designed to handle dead lettered (discarded) messages.
# Create the DLX to handle overflowed, expired or discarded by consumers
rabbitmqadmin declare exchange --vhost=vhtest name=DLXexQoverfloworttl type=headers internal=true
# Create the DLX to handle messages with wrong routing key
rabbitmqadmin declare exchange --vhost=vhtest name=DLXexQwrongtopic type=fanout internal=true
We’ll now declare and bind queues to the first DLX using three different policies
rabbitmqadmin declare queue --vhost=vhtest name=DLXquQoverflow
rabbitmqadmin declare queue --vhost=vhtest name=DLXquQttl
rabbitmqadmin declare queue --vhost=vhtest name=DLXquQrejected
rabbitmqadmin declare binding --vhost=vhtest source=DLXexQoverfloworttl destination=DLXquQoverflow arguments='{"x-first-death-reason": "maxlen", "x-match": "all-with-x"}'
rabbitmqadmin declare binding --vhost=vhtest source=DLXexQoverfloworttl destination=DLXquQttl arguments='{"x-first-death-reason": "expired", "x-match": "all-with-x"}'
rabbitmqadmin declare binding --vhost=vhtest source=DLXexQoverfloworttl destination=DLXquQrejected arguments='{"x-first-death-reason": "rejected", "x-match": "all-with-x"}'
And now we’ll declare and bind queues to the second DLX to handle messages with wrong topic (routing key)
rabbitmqadmin declare queue --vhost=vhtest name=DLXquQwrongtopic
rabbitmqadmin declare binding --vhost=vhtest source=DLXexQwrongtopic destination=DLXquQwrongtopic
Now we have 1 DLX with 3 queues and another DLX with 1 queue bound. The first will route expired, discarded and overflowed messages to the respective queues (DLXquQttl, DLXquQoverflow, DLXquQrejected), the second will route messages with invalid routing key to the respective queue (DLXquQwrongtopic).
Now we are going to create our main queue and the normal Exchange that will send message to it
rabbitmqadmin declare queue --vhost=vhtest name=quQ
rabbitmqadmin declare exchange --vhost=vhtest name=exQ type=direct
In this example, we want to route all messages with routing key NBE
rabbitmqadmin declare binding --vhost=vhtest source=exQ destination=quQ routing_key=NBE
We now want to create the policy that is needed to associate the wrong topic DLX to our main exchange
rabbitmqctl set_policy --vhost vhtest wrongtopicQ1 "^exQ$" '{"alternate-exchange":"DLXquQwrongtopic"}' --apply-to exchanges
This is an example policy to set limits to 100 messages, 1073741824 bytes, 30 seconds TTL to the quQ queue.
rabbitmqctl set_policy --vhost vhtest shorttimedqunbe '^quQ$' '{"max-length":100,"max-length-bytes":1073741824,"message-ttl":30000,"overflow":"reject-publish-dlx","dead-letter-exchange":"DLXexQoverfloworttl"}' --priority 0 --apply-to queues
Going to give proper permissions to our publish and subscriber users. The user testuserpub can only write to its exchange, while testusersub can read from its queue. No other permissions here.
rabbitmqctl set_permissions --vhost vhtest testuserpub '' '^exQ$' ''
rabbitmqctl set_permissions --vhost vhtest testusersub '' '' '^quQ$'
Mission complete. Please try this at home and write to the comments below! Happy RabbitMQ hacking!
Ancora c’è qualcuno che nel 2023 guadagna vendendo delle vecchie liste di mail prese qui e li a qualcun altro il quale spera di fare marketing in modi anni 90??? Basta, lo spam non è più di moda!
Credetemi, generalmente, la maggior parte delle volte, il cloud pubblico (Google GCP, Microsoft Azure, Amazon e2c) non è conveniente.
Costa tanto, costi imprevedibili, se hai problemi apri il ticket e ti mandano in prima battuta tecnici non competenti.
Io vi ho avvertito, poi fate come vi pare.
Usare Mastodon mi ricorda un po’ gli albori di internet e del web, tempi in cui lo spam, la pubblicità, gli algoritmi, l’AI, gli influencer e i social non c’erano ancora. Tutto era più libero e meno commerciale. A quei tempi era quasi tutto tranquillo e l’informatica era una passione. Li nacque l’opensource. Ora mi sembra tutto pilotato dal commercio, dal vendere, apparire a tutti i costi, dal fare hype e monetizzare il prima possibile. Grazie Mastodon per avermi riportato negli anni ’90 🙂
The time! Time is our most precious thing. Don’t waste it!