Monitoring the health of your UPS (Uninterruptible Power Supply) is crucial to ensure your systems are protected from power outages and electrical anomalies. In this project, I built a Grafana dashboard that visualizes real-time UPS metrics collected via apcaccess and delivered to InfluxDB through Telegraf.
How It Works
The workflow consists of four key components:
- apcaccess — The command-line tool that queries an APC UPS through the
apcupsddaemon (via USB). - Custom Bash Script — Extracts and formats specific UPS metrics from
apcaccess. - Telegraf — Executes the script, parses the output, and sends the data to InfluxDB.
- Grafana — Reads from InfluxDB and displays the data in a visual, interactive dashboard.
The Bash Script
The script get_ups_values.sh calls apcaccess -u, which outputs UPS status in an easy-to-parse, colon-separated format.
Using awk, we clean and format these values into InfluxDB’s line protocol:
#!/bin/bash
KEYS=$(
apcaccess -u | awk -F: '
{
    gsub(/^[ \t]+|[ \t]+$/, "", $2)
}
/MODEL/      {out=out "model=" $2 ","}
/SERIALNO/   {out=out "serialno=" $2 ","}
/NOMPOWER/   {out=out "nompower=" $2 ","}
END {
    sub(/,$/, "", out)
    print out
}
'
)

VALS=$(
apcaccess -u | awk -F: '
{
    gsub(/^[ \t]+|[ \t]+$/, "", $2)
}
/STATUS/    {out=out "ups_status=\"" $2 "\","}
/LINEV/     {out=out "ups_input_volts=" $2 ","}
/OUTPUTV/   {out=out "ups_output_volts=" $2 ","}
/LOADPCT/   {out=out "ups_load_pct=" $2 ","}
/BCHARGE/   {out=out "ups_battery_charge=" $2 ","}
/TIMELEFT/  {out=out "ups_time_left_min=" $2 ","}
/TONBATT/   {out=out "ups_time_on_battery=" $2 ","}
/CUMONBATT/ {out=out "ups_total_time_on_battery=" $2 ","}
/NUMXFERS/  {out=out "ups_transfer_count=" $2 ","}
END {
    sub(/,$/, "", out)
    print out
}
'
)
echo "ups,host=$(uname -n),source=apcaccess,$KEYS $VALS"
Telegraf Configuration
In /etc/telegraf/telegraf.d/get_ups_values.conf, we add an exec input plugin to run the script at regular intervals:
[[inputs.exec]]
  commands = ["/usr/local/bin/get_ups_values.sh"]
  timeout = '30s'
  data_format = "influx"
  interval = "30s"
Every 10 seconds, Telegraf runs the script, captures the metrics, and sends them directly to InfluxDB.
The InfluxDB Data Model
The script’s output already matches InfluxDB’s line protocol format, making ingestion seamless.
Each metric is stored with tags and fields, making it easy to query in Grafana:
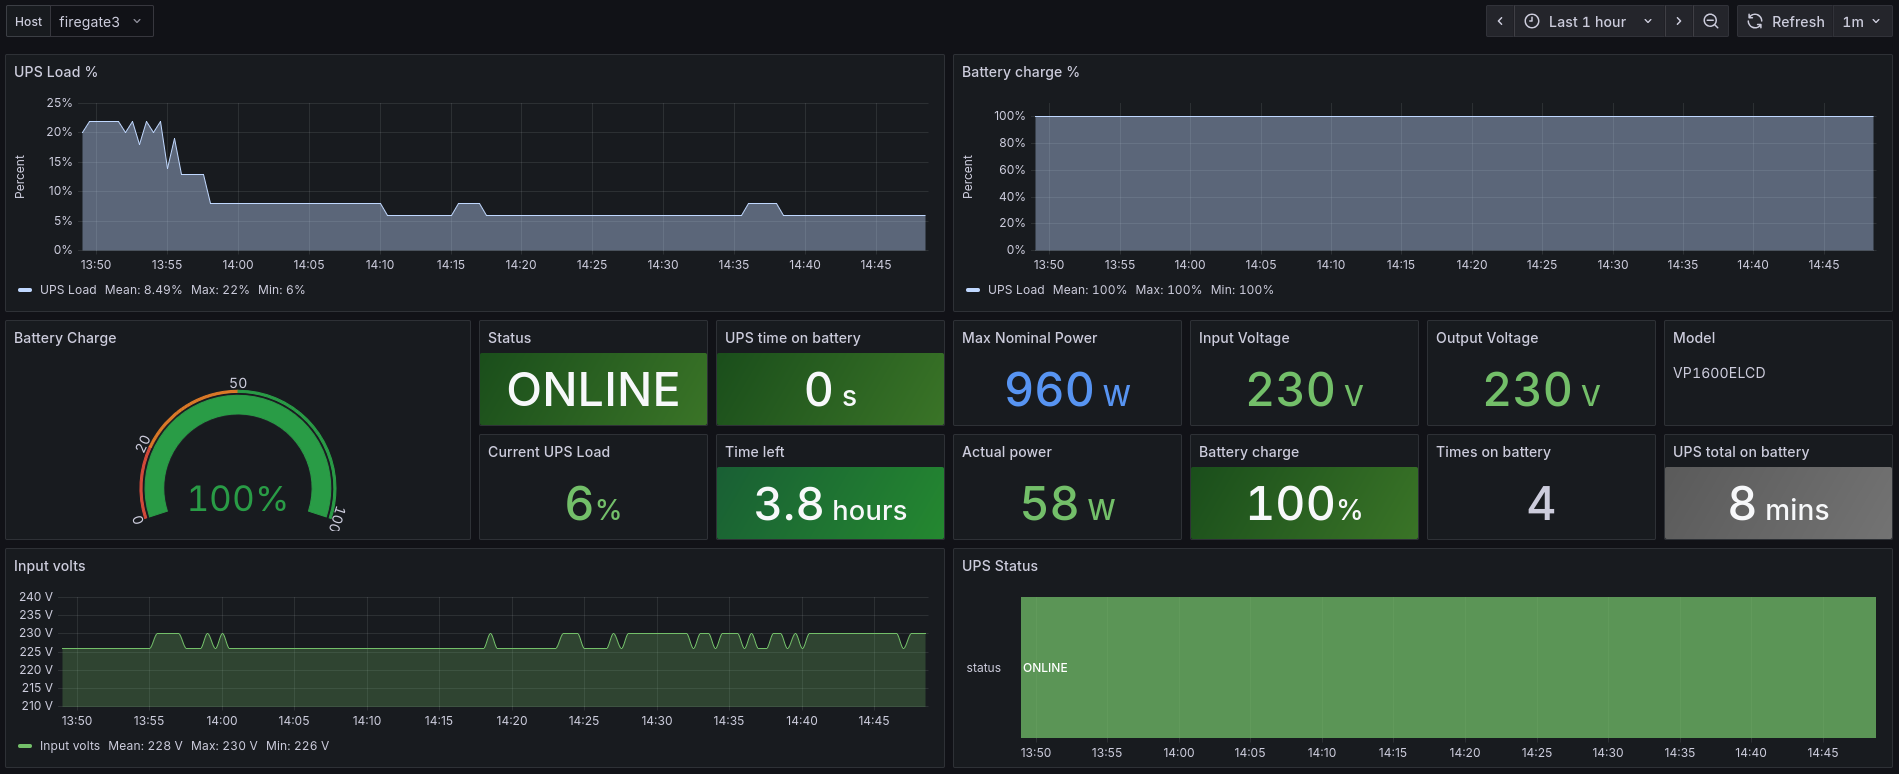
ups,host=firegate3,source=apcaccess,model=VP1600ELCD,nompower=960 ups_status="ONLINE",ups_input_volts=226.0,ups_load_pct=6.0,ups_battery_charge=100.0,ups_time_left_min=229.5,ups_output_volts=226.0,ups_transfer_count=4,ups_time_on_battery=0,ups_total_time_on_battery=480The Grafana Dashboard
Once the data is in InfluxDB, Grafana can query it to display:
- UPS Status (ONLINE, ONBATT, etc.)
- Input & Output Voltage
- Load Percentage
- Battery Charge
- Time Left on Battery
- Number of Transfers to Battery
The result is a real-time dashboard that not only provides immediate visibility but also stores historical data for trend analysis.
Some of the benefits are:
- Proactive Monitoring — Detect issues before they become critical.
- Historical Insights — Spot patterns in power quality over time.
- Automation-Friendly — Integrates easily with alerts in Grafana.
Conclusion
With just a few lines of Bash, a Telegraf exec plugin, and a Grafana dashboard, you can transform raw UPS data into a rich monitoring experience. This setup is lightweight, flexible, and easy to expand with additional metrics or automation triggers.
You can get my grafana UPS dashboard json for free.
HTH.
Lascia un commento