So, with this second article about grafana we are going to dashboard a Fritz!box router.
Same as the previous article, you need a grafana+influxdb installation somewhere. Also you’ll need a linux host connected to the fritz router to monitor, a Raspberry pi 4 will be more than OK.
Install telegraf on your rpi4, then follow these instructions:
https://github.com/Ragin-LundF/telegraf_fritzbox_monitor
Once you’ve installed the required software you’ll end up with the sw installed into /opt/telegraf_fritzbox and a configuration file into /etc/telegraf/telegraf.d/telegraf_fritzbox.conf.
Open and modify this last file in this way:
[[inputs.exec]]
  commands = ["python3 /opt/telegraf_fritzbox/telegraf_fritzbox.py"]
  timeout = '30s'
  data_format = "influx"
  interval = "30s"
Now edit this file: /opt/telegraf_fritzbox/config.yaml and setup your fritz router’s username and password connection. NOTE: It’s a good thing to create a dedicated user.
It’s possible to test this command to check if the connection with ther router is working:
python3 /opt/telegraf_fritzbox/telegraf_fritzbox.py ; chown telegraf:telegraf /opt/telegraf_fritzbox/fritz.db
If everything is ok you should have a list of metrics coming from your router.
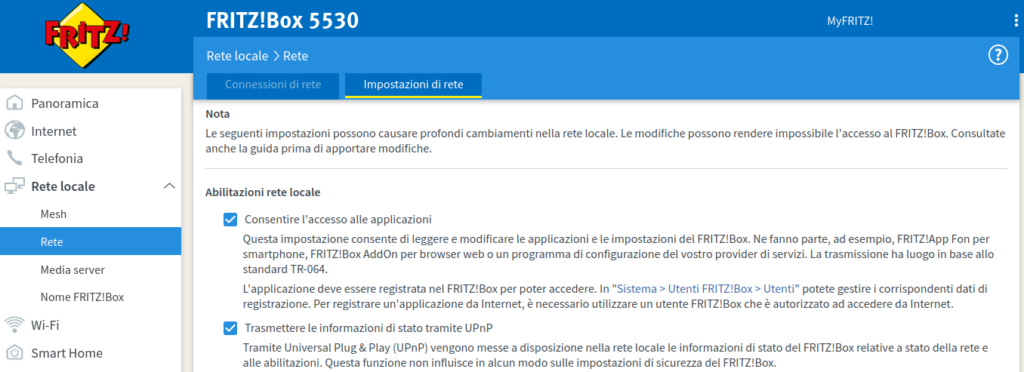
Please note that you need to enable UPnP status on your router networking configuration or you’ll have an error regarding a unknown service.
Now, restart telegraf with service telegraf restart.
It’s now time to import the grafana dashboard. I had big problems with the official json from https://github.com/Ragin-LundF/telegraf_fritzbox_monitor/blob/main/GrafanaFritzBoxDashboard_Influx2.json so I put my modified dashbord here.
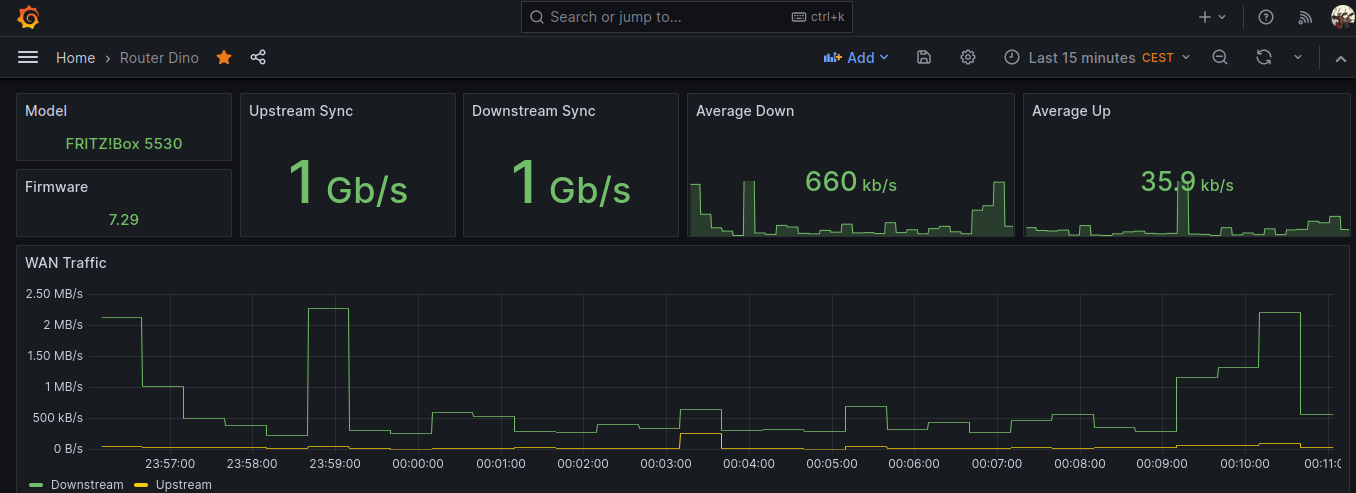
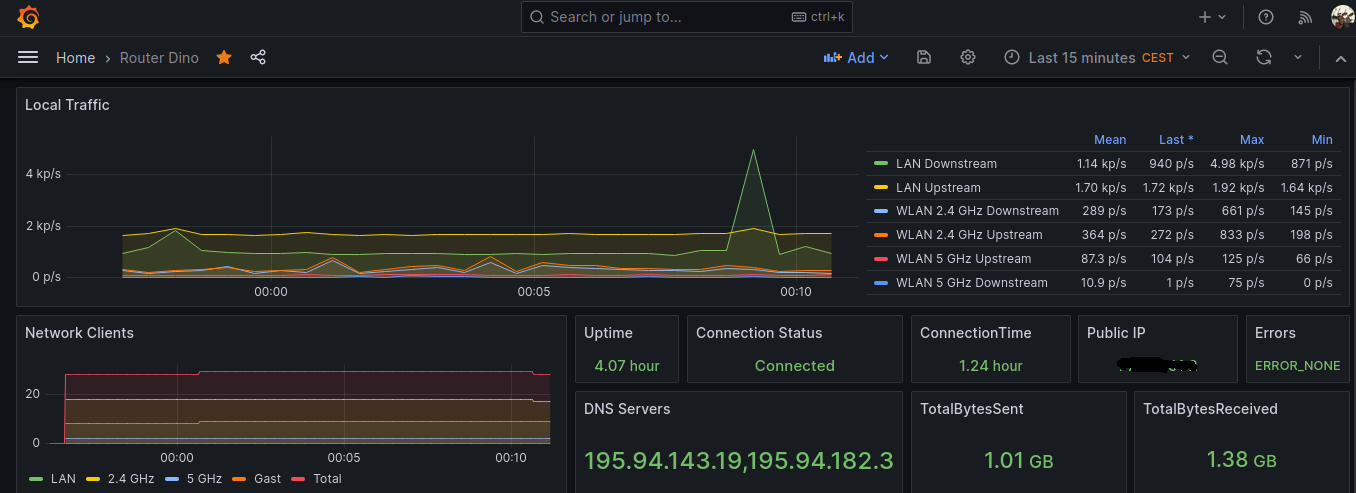
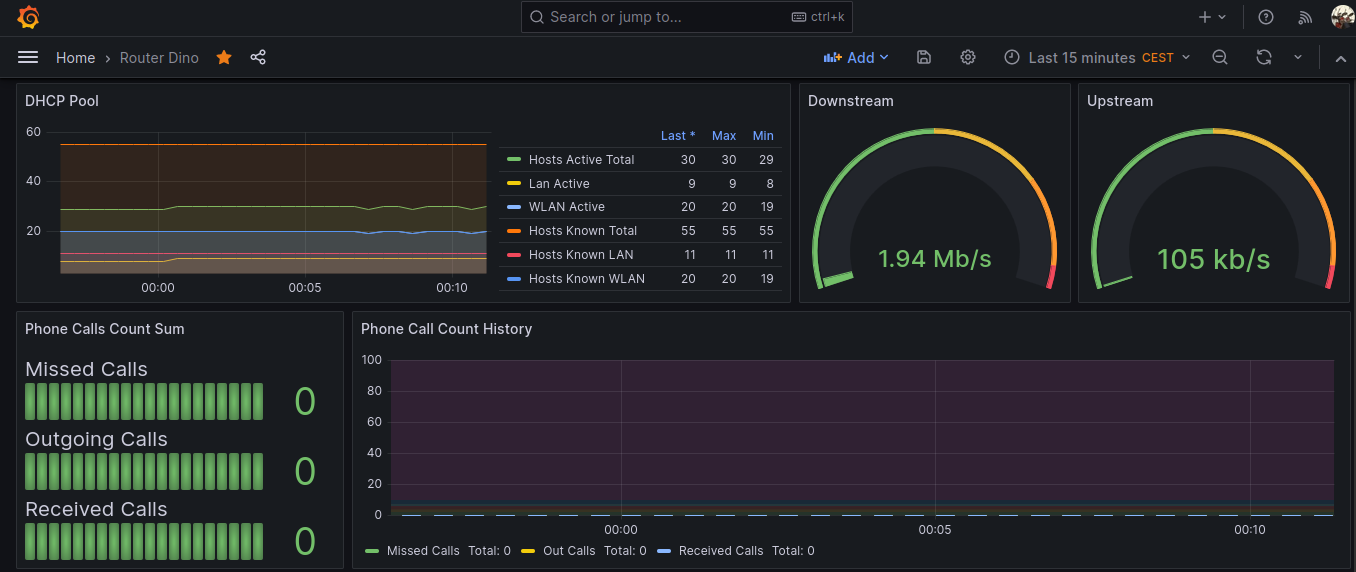
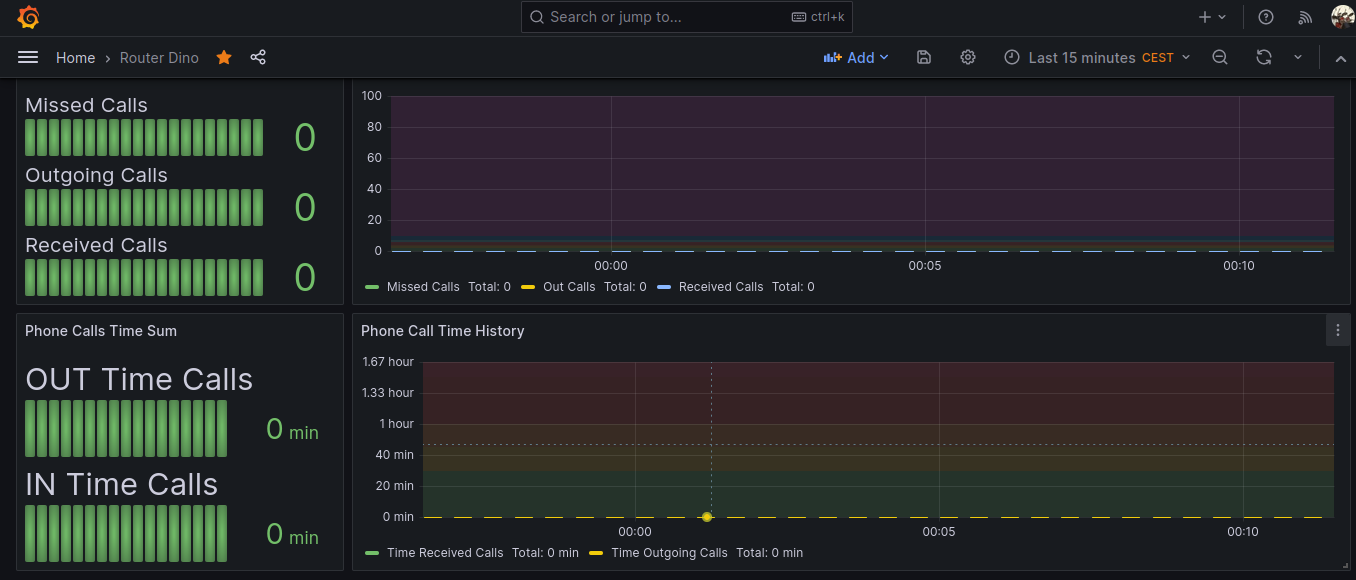
Some screenshots here
A really big thank goes to the software author Ragin-LundF -> https://github.com/Ragin-LundF