There are tons of documentation and howtos on the web regarding system monitoring and metrics dashboards, so I don’t put all the boring stuff here.
You may want to have a central grafana and influxdb installation, then a telegraf installation on every node to monitor. For example you may have a grafana + influxdb installation somewhere in the cloud, a VPN, and a couple of raspberry pi nodes that gather metrics and send them to the central influxdb+grafana node for storage and visualization.
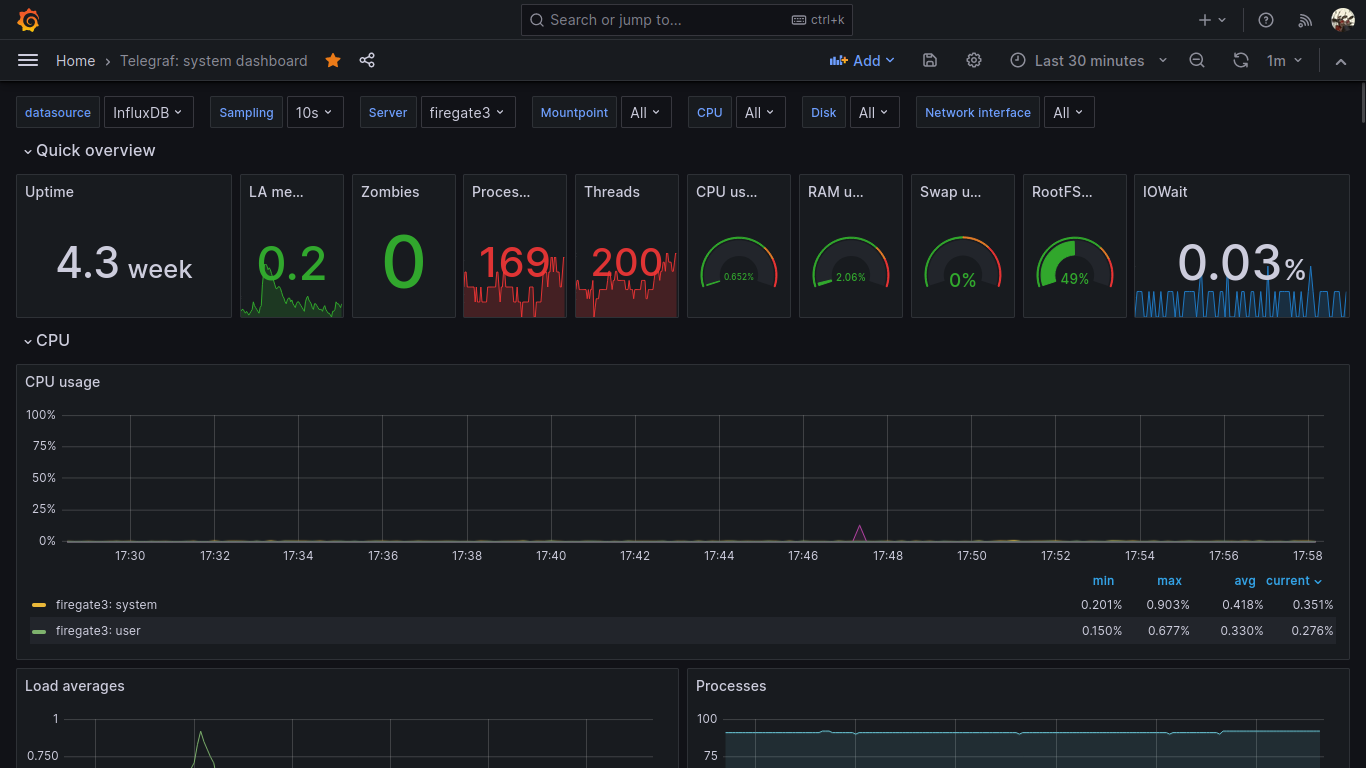
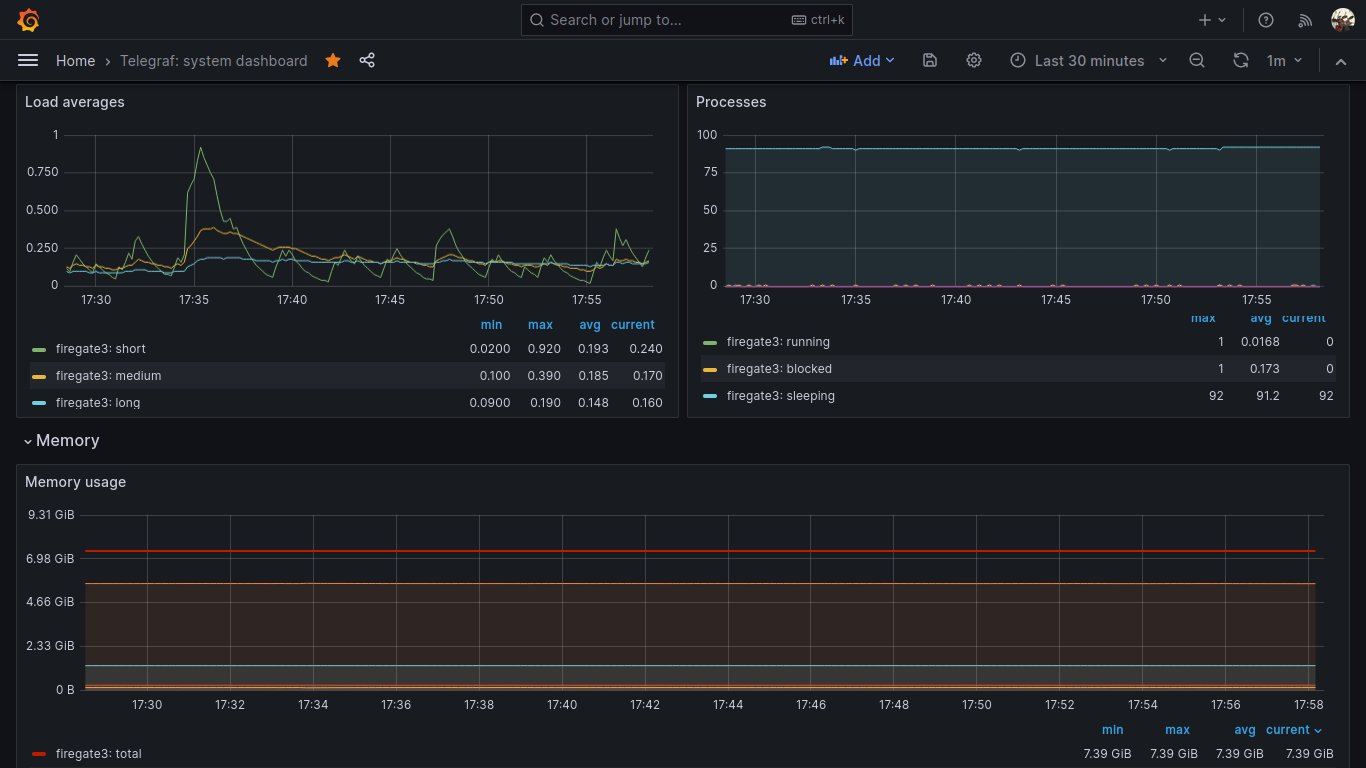
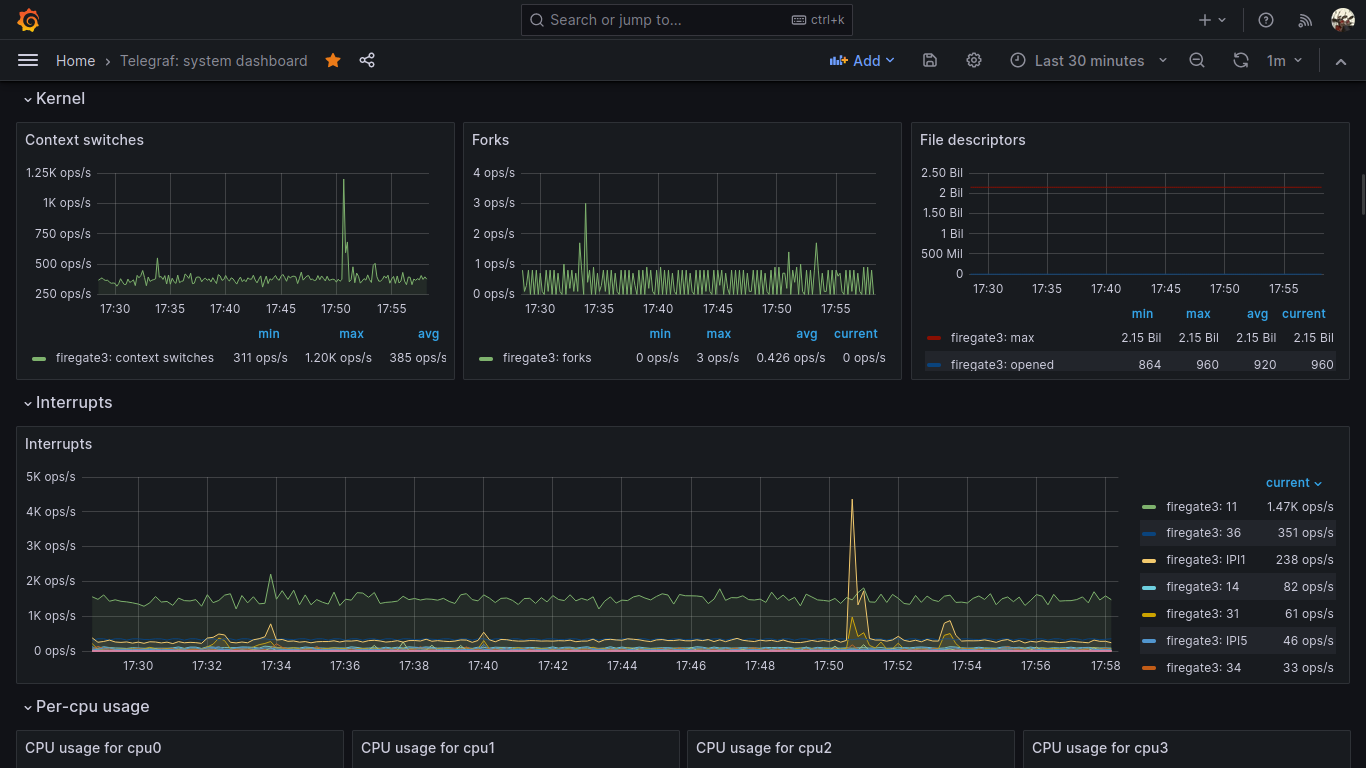
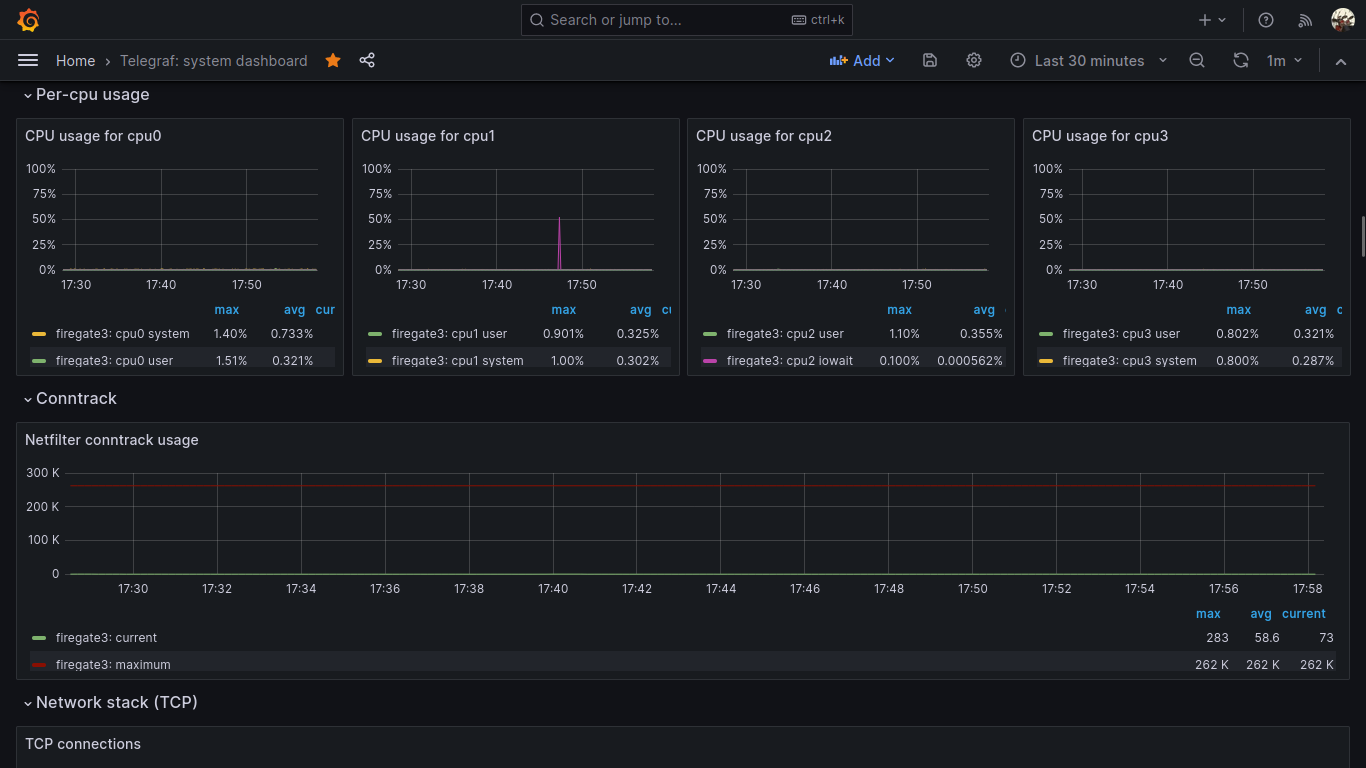
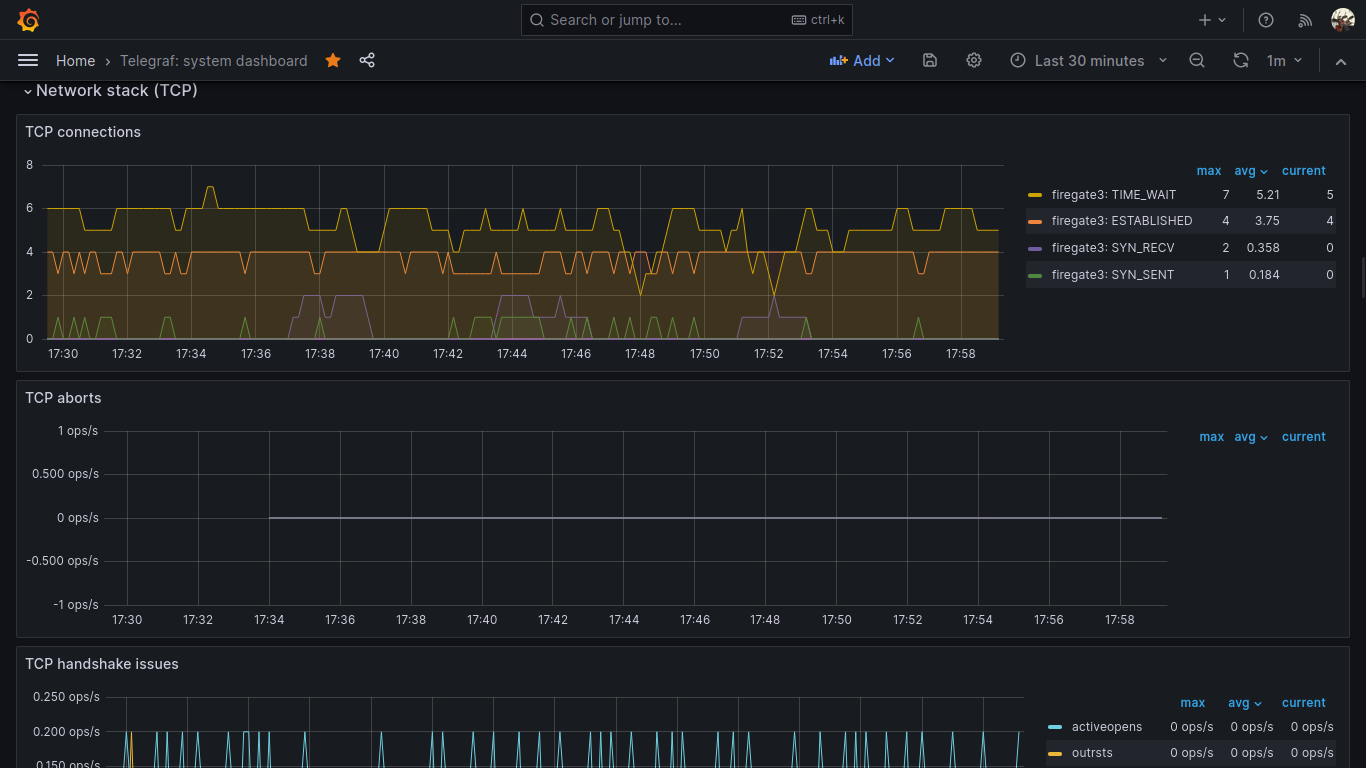
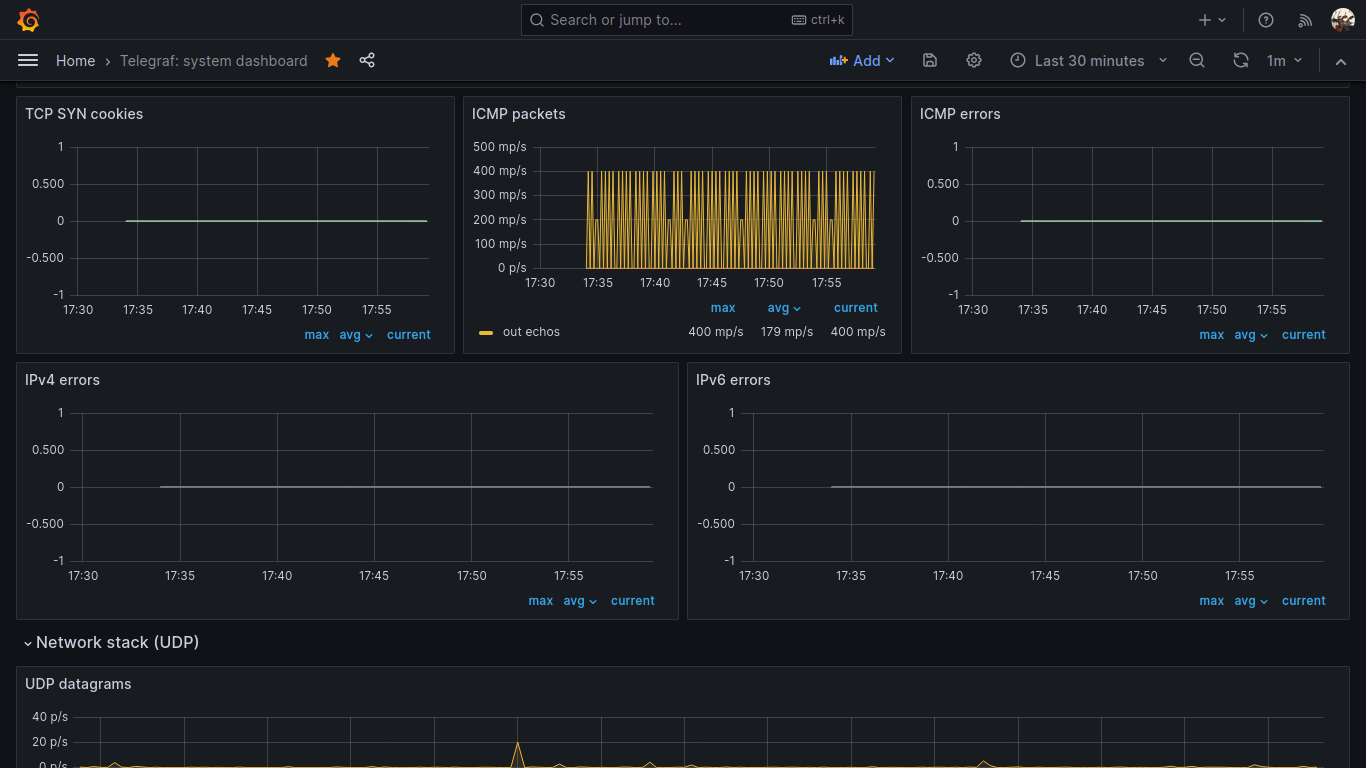
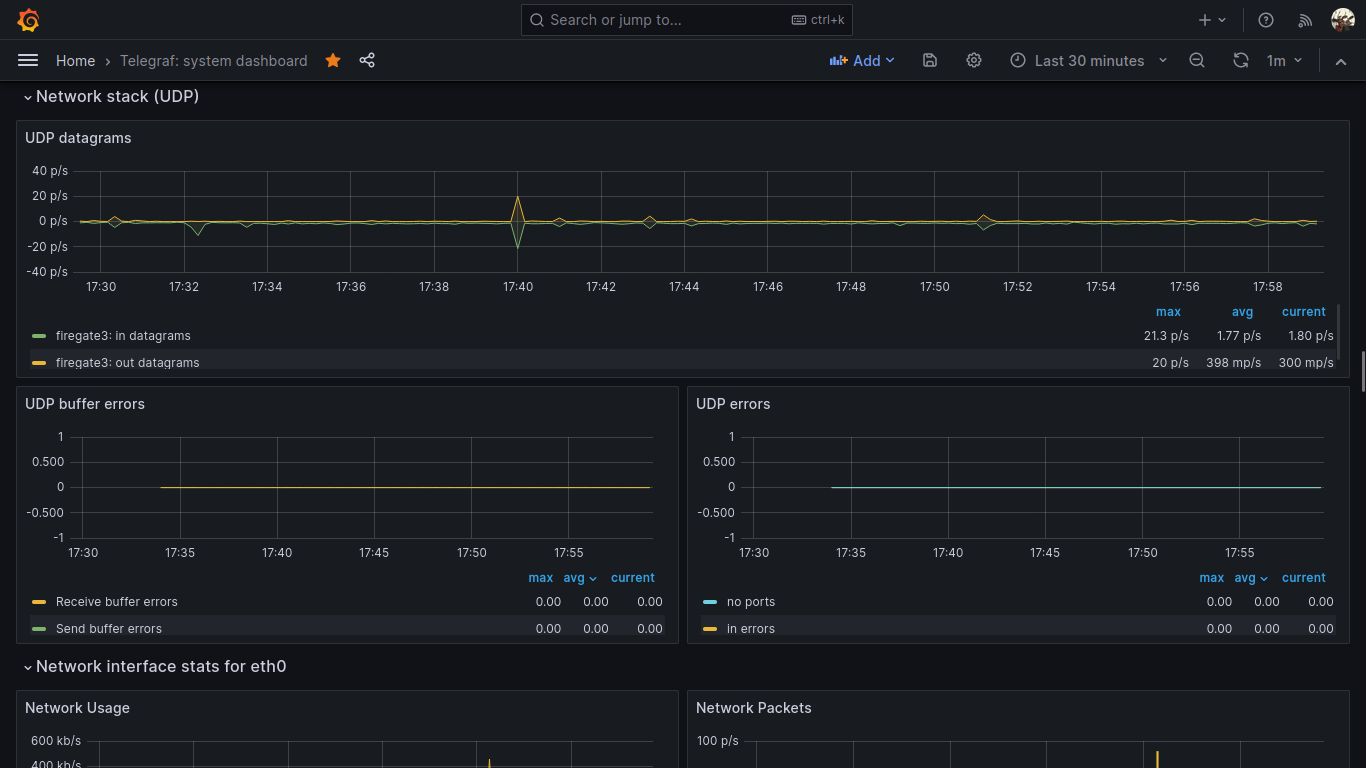
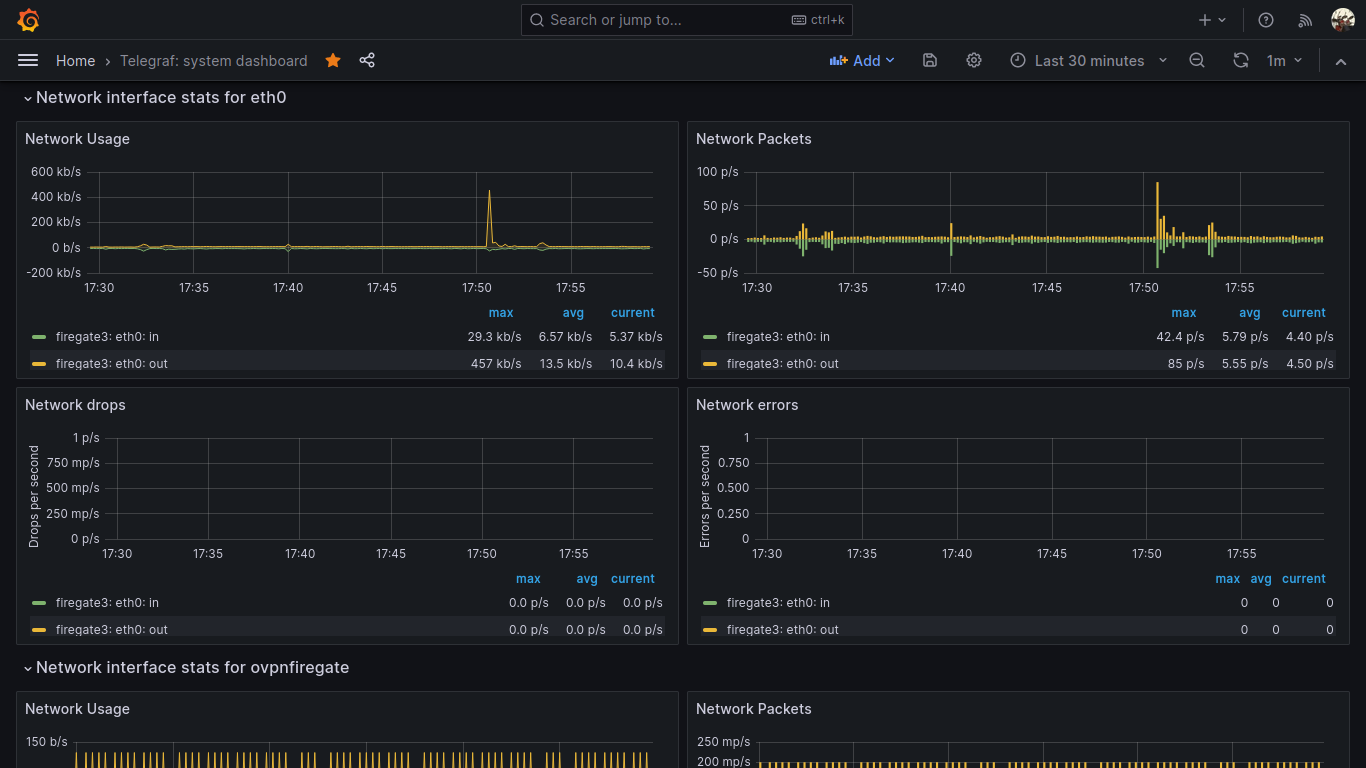
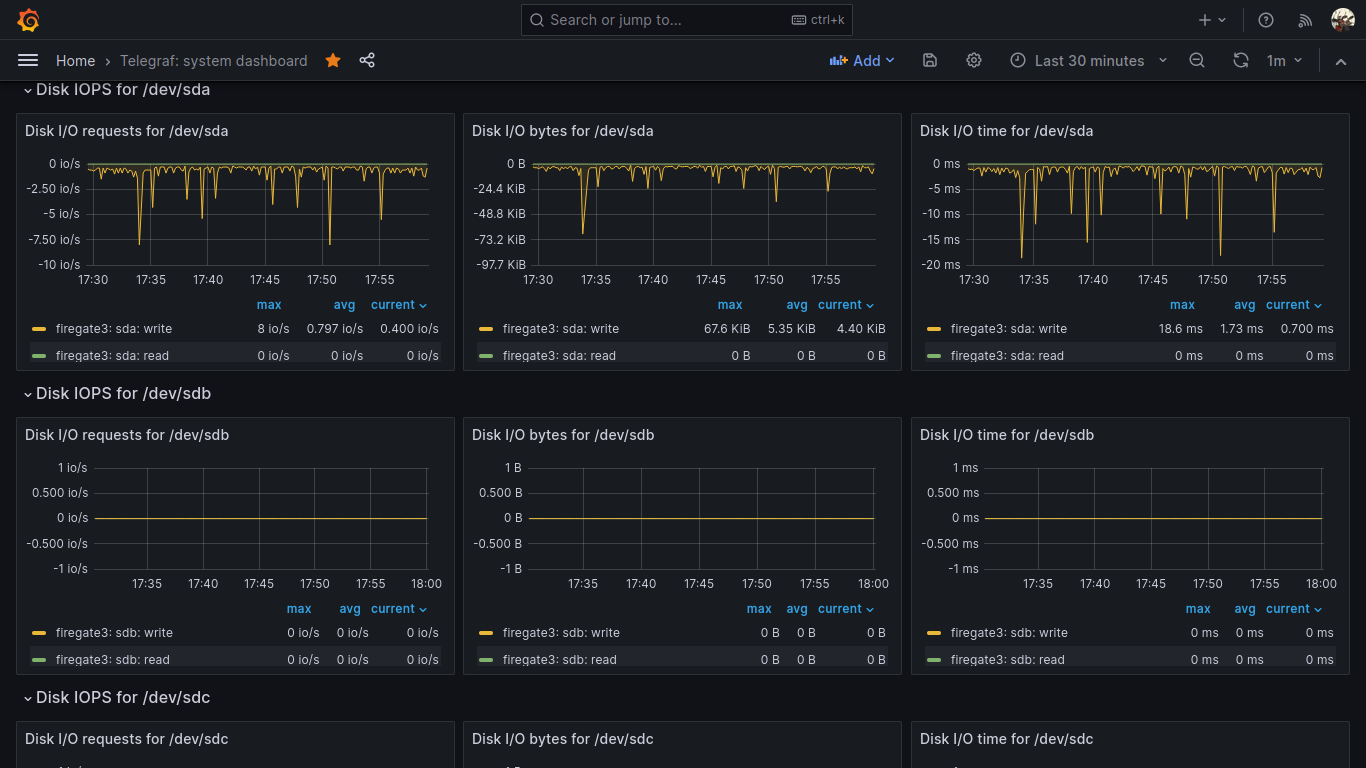
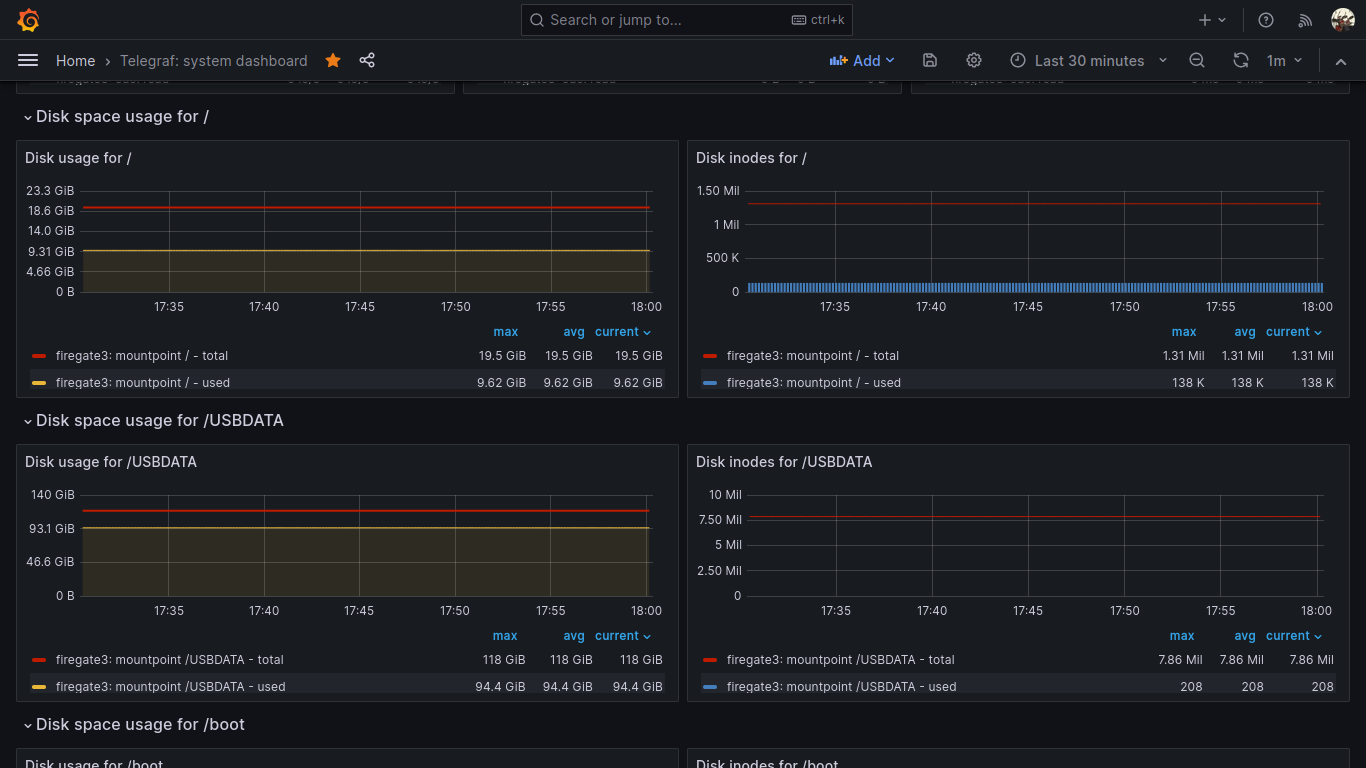
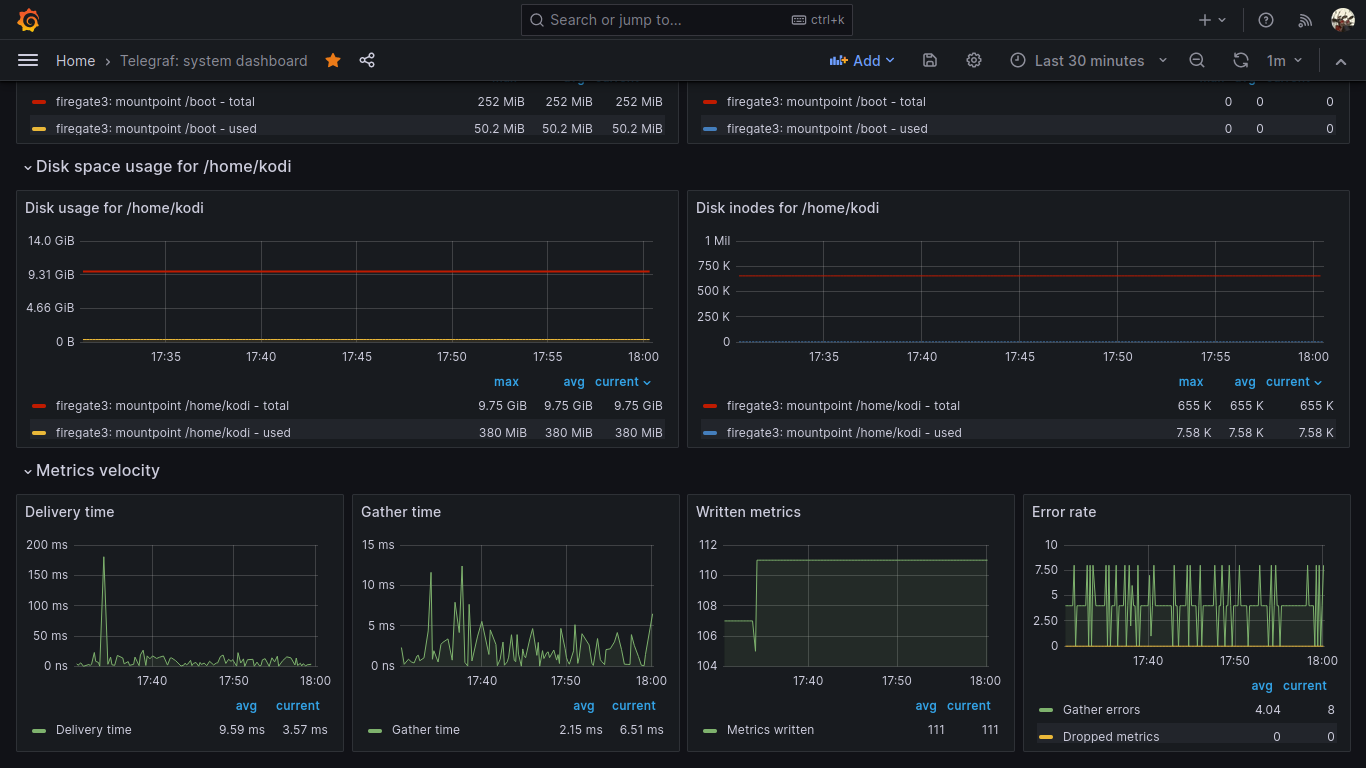
For this task, I use this beautiful grafana dashboard: https://grafana.com/grafana/dashboards/928-telegraf-system-dashboard/
Just import this dashbord to your local or remote grafana installation.
To make all those panels working, all your nodes to be monitored must have this telegraf plugins enabled and configured:
[[inputs.cpu]]
percpu = true
totalcpu = true
collect_cpu_time = false
report_active = false
core_tags = false
[[inputs.disk]]
ignore_fs = ["tmpfs", "devtmpfs", "devfs", "iso9660", "overlay", "aufs", "squashfs"]
[[inputs.diskio]]
[[inputs.kernel]]
[[inputs.mem]]
[[inputs.processes]]
use_sudo = false
[[inputs.swap]]
[[inputs.system]]
[[inputs.conntrack]]
files = ["ip_conntrack_count","ip_conntrack_max",
"nf_conntrack_count","nf_conntrack_max"]
dirs = ["/proc/sys/net/ipv4/netfilter","/proc/sys/net/netfilter"]
collect = ["all", "percpu"]
[[inputs.internal]]
[[inputs.interrupts]]
[inputs.interrupts.tagdrop]
irq = [ "NET_RX", "TASKLET" ]
[[inputs.linux_sysctl_fs]]
[[inputs.net]]
[[inputs.netstat]]
[[inputs.nstat]]
proc_net_netstat = "/proc/net/netstat"
proc_net_snmp = "/proc/net/snmp"
proc_net_snmp6 = "/proc/net/snmp6"
dump_zeros = true
Also, remember to configure your telegraf output to send collected metrics to your central influxdb node:
[[outputs.influxdb_v2]]
urls = ["http://192.168.0.2:8086"]
token = "A1ycabIZjg3XjulgubSanvPEdoj7UxqmEbsPADXX_h1Ns3-kTspG63s0SP3wuR0MGisd62rx9jLzExrhPvKAUg=="
organization = "YourOrg"
bucket = "YourBucket"
Enjoy your system telegraf metrics visualized 🙂