Ok, it’s been a while since I wrote anything here, but that doesn’t mean I’m not doing anything technically challenging. I’m a noob with stock markets but I realized that the solutions provided by my broker are nice but not perfect for me. I would like to have a deeper sight on stock markets to make better decisions (I’ve lost > 98% of my invested capital buying a wrong ticker… you know, bad hydrogen cell green company?!!??). So I decided that I want to observe my stocks candles and indicators near real-time on a self hosted dashboard. I also want to store stock data on a DB on-premise so that I can make custom queries without worry about limited external API requests.
After some scouting on the web / IA chatbots, I decided to implement the dashboard on a self hosted Grafana, with self-hosted PostgreSQL + TimescaleDB as time-series capable DB, getting financial data in near-realtime from a nice vendor (99$/month).
Spending two words about the DB schema, I’d like to select tickers and markets and I’d like a wonderful performance to switch tickers, periods and timeframes, so I’ll need proper DB schema, ER, optimized queries, indexes and foreign keyes.
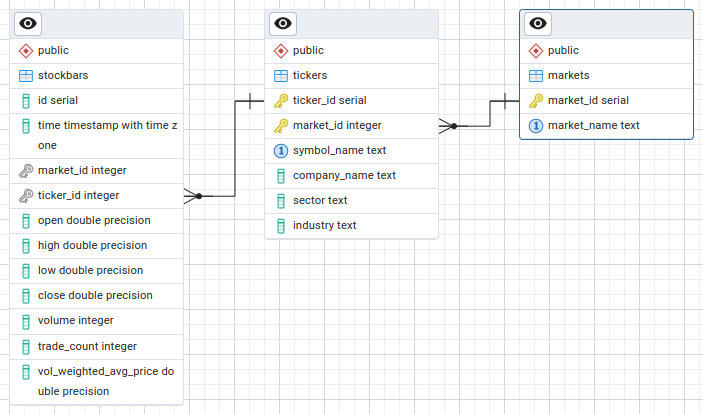
The first is the stockbars table and is responsible of storing candles (open, high, low, close, volume, trades, etc). It’s market_id and ticker_id are coupled with the second table, called tickers. It will contain any stock ticker and its optional details. It’s market_id and ticker_id are then coupled with the third table called markets that has the task of storing markets (NASDAQ, NYSE, etc). This way I can easily make JOIN to get the requested ticker from the requested markets normalizing data and avoiding to duplicate and waste storage space. This also permits the DB engine to use indexes and foreign keys, optimizing rows fetch from the storage and performing really well even on big tables.
But how can I make queries to aggregate data in the requested timeframe? Postgres doesn’t have this feature, so I need TimescaleDB extension. This is a really nice piece of software that can transform your RDBMS to a fully featured time-series DB. I just need to make the stockbars table a TimescaleDB hypertable. It will automatically partition the table to the proper format to make the magic timeperiod happen in background.
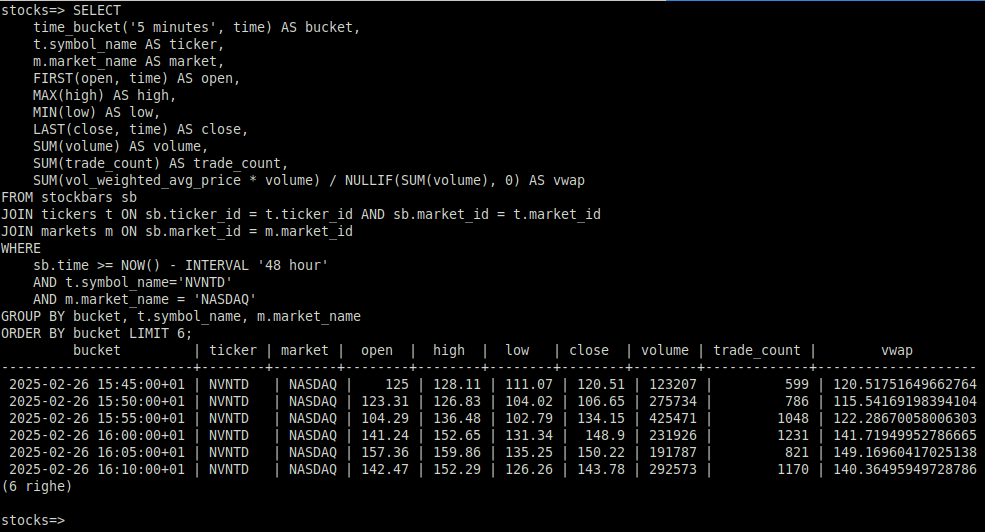
So, thanks to TimescaleDB I’m able to change the timeframe (5 min), the observed period (48 hours), or get aggregated info (NVNTD ticker on NASDAQ market. NVNTD is a non existent stock created just to test the system).
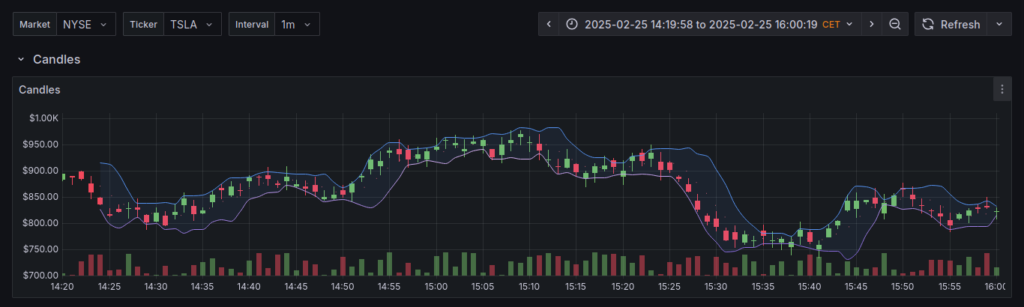
Now, I just need to create the grafana dashboard, and since PostgreSQL and TimescaleDB are fully and natively supported by grafana, I took just a couple of minutes to integrate the dashboard and show my candles (TSLA ticker on NYSE market here with random market data, just for testing reasons).
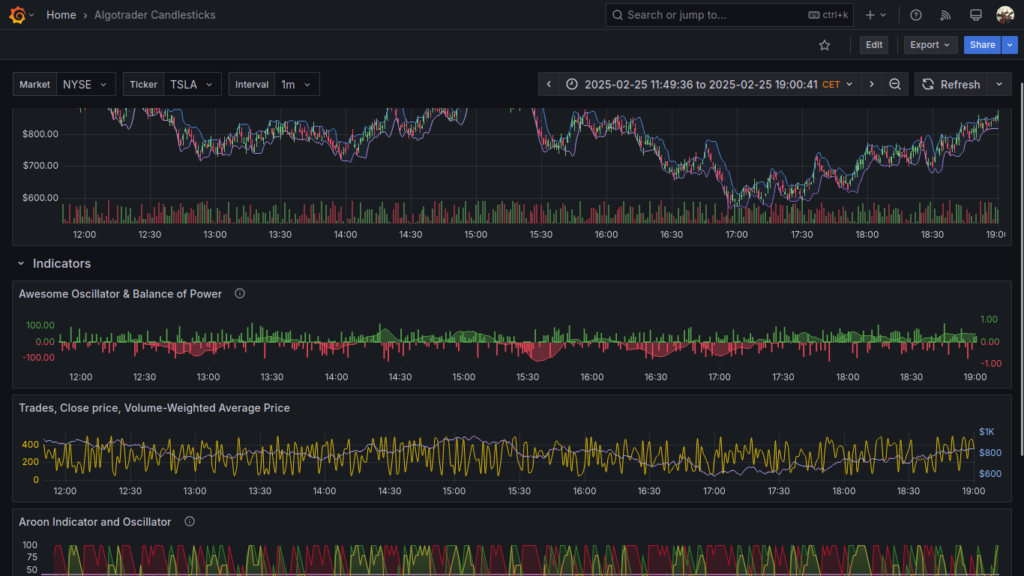
OK, nice!! So I built a custom Grafana dashboard to show candlesticks of my watched stocks, and some of you may have noticed that Bollinger Bands are present in the chart but postgres, timescaledb and grafana alone are not capable of generating indicators or overlays like Bollinger Bands…
Have you ever thought of a PostgreSQL extension that is able to generate indicators and overlays in C as postgres functions? I did not find anything ready, so I’ve written the postgres extension myself, with the help of the Tulip Indicators library as a math buddy. More will come here… if there will be some hype.